Introduction
Setting up a Kubernetes cluster in my homelab was just the first step. The real challenge came when I needed to monitor everything running on it—metrics, logs, and traces—without consuming all my server’s RAM or dealing with a complex, fragmented setup.
I wanted a solution that was lightweight, easy to manage via Helm, and capable of handling the full observability stack in a single deployment. That’s how I landed on the Grafana-Victoria Stack. It combines VictoriaMetrics, VictoriaLogs, VictoriaTraces, and Grafana into one cohesive package perfect for home labs or small-scale environments.
In this post, I’m walking through exactly how I deployed this stack on my cluster. Whether you are looking to save resources or just want a clean way to visualize your homelab data, follow along to see how I made it work.
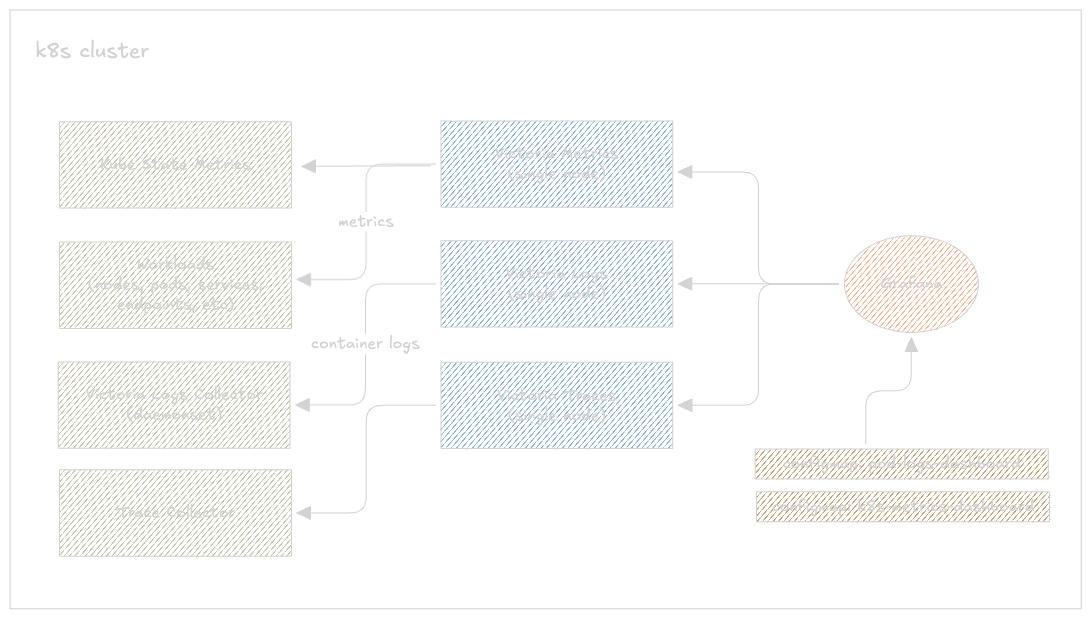 A simple implementation diagram
The Victoria Stack Components
Before jumping into the deployment, let me quickly run through what each piece of this stack does.
VictoriaMetrics Single
A single-node time series database that acts as a drop-in replacement for Prometheus. It scrapes metrics from your cluster — nodes, pods, deployments, everything — and stores them long term. It exposes a PromQL-compatible API on port 8428, so Grafana talks to it exactly like it would talk to Prometheus. Compared to running a full Prometheus setup, it uses significantly less RAM and disk for the same workload, which matters a lot in a homelab.
VictoriaLogs Single
The log storage backend. It ingests log streams, indexes them, and serves them over a LogsQL API on port 9428. Think of it as a lightweight alternative to Loki — same idea, much lower resource footprint. It stores everything on a single PVC, no object storage required.
VictoriaLogs Collector
This is what actually ships logs from your cluster into VictoriaLogs. It runs as a DaemonSet — one pod per node — tailing container logs from /var/log/containers/ and forwarding them to the VictoriaLogs single instance. No need to set up Fluent Bit or Promtail separately, this chart handles it all.
VictoriaTraces Single
The newest addition to the VictoriaMetrics family and still fairly early (v0.0.6). It stores distributed traces sent via OTLP from your applications and exposes a Jaeger-compatible API so Grafana can query them. If your apps are already instrumented with OpenTelemetry, this just works as the backend. All you need to do is replace the OpenTelemetry collector url with victoriatraces url.
Grafana
The single pane of glass for all three signal types. In this setup Grafana is configured with three datasources pointing at VictoriaMetrics, VictoriaLogs, and VictoriaTraces respectively — letting you correlate metrics, logs, and traces from one place.
Installing metrics-server
Metrics Server is a small, in-memory component that collects CPU and memory usage from every node’s kubelet and exposes it through the Kubernetes Metrics API. It doesn’t store anything long-term — it just holds the latest snapshot, which is enough for kubectl top to work and for the Horizontal Pod Autoscaler to make scaling decisions.
Think of it as your cluster’s short-term memory for resource usage. VictoriaMetrics (which we’re setting up next) is the long-term memory — it scrapes and stores historical data over time.
I used Helm to keep things consistent with the rest of my setup:
helm repo add metrics-server https://kubernetes-sigs.github.io/metrics-server/
helm repo update

helm upgrade --install metrics-server metrics-server/metrics-server \
  --namespace kube-system
The --kubelet-insecure-tls flag is necessary in my homelab because my kubelets use self-signed certificates. If you’re in a similar setup, you’ll need this too — without it, metrics-server just fails to scrape and sits there doing nothing.
Checking it works
Give it about a minute to run its first scrape cycle, then:
(⎈|inferno-talos:default) ➜  ~ k top nodes
NAME                      CPU(cores)   CPU(%)   MEMORY(bytes)   MEMORY(%)
inferno-talos-cp-01       564m         28%      3005Mi          41%
inferno-talos-worker-01   1208m        20%      6317Mi          40%
inferno-talos-worker-02   1084m        18%      4784Mi          30%
inferno-talos-worker-03   1145m        19%      4249Mi          27%
If you still get error: metrics not available yet, just wait another minute and try again. Once this is showing real numbers, you’re good to move on.
metrics-server docs: https://github.com/kubernetes-sigs/metrics-server?tab=readme-ov-file#installation
Creating a Combine Helm Chart
Rather than managing five separate Helm releases, I bundled everything into a single umbrella chart I called grafana-victoria-stack. This keeps all my observability tooling versioned together and deployable with one command.
Chart structure
grafana-victoria-stack/
├── Chart.yaml                          # chart metadata + dependencies
├── charts/                             # pulled by helm dependency update
├── dashboards/
│   └── k8s-logs-via-victorialogs.json  # pre-built Grafana dashboard
├── templates/
│   └── dashboards
│       └── configmap.yaml              # ConfigMaps template for dashboard provisioning
├── external-secrets.yaml               # secrets pulled from external store
├── values.yaml                         # single config file for everything
└── grafana-victoria-stack-1.0.0.tgz    # packaged chart
A few things worth calling out here. The dashboards/ directory holds a pre-built Grafana dashboard JSON for Kubernetes logs via VictoriaLogs — more on that when we get to the Grafana setup. The templates/dashboards/ folder contains the ConfigMaps that tell Grafana to auto-provision those dashboards on startup, so you don’t have to import anything manually. And external-secrets.yaml is how I handle credentials without hardcoding them into values.yaml — I’ll cover that separately.
Chart.yaml
apiVersion: v2
description: "A lightweight monitoring stack combining VictoriaMetrics single-node and Grafana, managed via Helm."
type: application
name: grafana-victoria-stack
version: 1.0.0
appVersion: v1.0.0

dependencies:
  - name: victoria-metrics-single
    version: "0.9.3"
    repository: https://victoriametrics.github.io/helm-charts
    condition: victoria-metrics-single.enabled

  - name: victoria-logs-single
    version: "0.11.26"
    repository: https://victoriametrics.github.io/helm-charts
    condition: victoria-logs-single.enabled

  - name: victoria-logs-collector
    version: "0.2.9"
    repository: https://victoriametrics.github.io/helm-charts
    condition: victoria-logs-collector.enabled

  - name: victoria-traces-single
    version: "0.0.6"
    repository: https://victoriametrics.github.io/helm-charts
    condition: victoria-traces-single.enabled

  - name: grafana
    version: "10.5.5"
    repository: https://grafana.github.io/helm-charts
    condition: grafana.enabled
Five dependencies, all pinned to exact versions. The condition field on each one maps to an enabled flag in values.yaml — flip any of them to false to skip that component entirely during install.
Fetching the dependencies
cd ./grafana-victoria-stack
helm dependency update
This reads your Chart.yaml, pulls all five sub-charts from their respective Helm repos, and drops the .tgz files into the charts/ directory. The Chart.lock file gets updated with the exact resolved versions — commit both files so your setup is fully reproducible.
Why an umbrella chart over separate releases
- Single
helm upgradetouches everything at once - One
values.yamlto rule them all - Flip
victoria-traces-single.enabled: falseto disable any component without touching the chart - The whole thing packages into a single
.tgz— easy to share or archive
helm package ./grafana-victoria-stack
TIP: You can also use
helm package -u .which combineshelm dependency updateandhelm packageinto a single command — useful when you’ve just bumped a dependency version and want to repackage immediately without running two commands.
Configuring values.yaml
VictoriaMetrics Single
victoria-metrics-single:
  enabled: true
  server:
    scrape:
      enabled: true
      config:
        global:
          scrape_interval: 15s
Instead of running a separate vmagent or Prometheus, I enabled the built-in scraper directly on VictoriaMetrics. It scrapes every target every 15 seconds. Here’s a breakdown of each scrape job.
Self-monitoring
- job_name: victoriametrics
  static_configs:
    - targets: ["localhost:8428"]

- job_name: victoriatraces
  static_configs:
    - targets: ["victoria-traces-single-server:10428"]
  metrics_path: /metrics
VictoriaMetrics and VictoriaTraces both expose their own internal metrics. Scraping them means you can track things like ingestion rate, query latency, and storage usage directly in Grafana.
Kubernetes API server
- job_name: "kubernetes-apiservers"
  kubernetes_sd_configs:
    - role: endpoints
  scheme: https
  tls_config:
    ca_file: /var/run/secrets/kubernetes.io/serviceaccount/ca.crt
    insecure_skip_verify: true
  bearer_token_file: /var/run/secrets/kubernetes.io/serviceaccount/token
  relabel_configs:
    - source_labels:
        [__meta_kubernetes_namespace, __meta_kubernetes_service_name, __meta_kubernetes_endpoint_port_name]
      action: keep
      regex: default;kubernetes;https
This scrapes metrics from the Kubernetes API server itself — request rates, latency, error counts. It uses the pod’s mounted service account token to authenticate. The insecure_skip_verify: true is needed on Talos since the API server uses self-signed certs. The relabel_configs filter keeps only the actual API server endpoint and ignores everything else that gets discovered.
Node metrics
- job_name: "kubernetes-nodes"
  scheme: https
  tls_config:
    insecure_skip_verify: true
  bearer_token_file: /var/run/secrets/kubernetes.io/serviceaccount/token
  kubernetes_sd_configs:
    - role: node
  relabel_configs:
    - action: labelmap
      regex: __meta_kubernetes_node_label_(.+)
    - target_label: __address__
      replacement: kubernetes.default.svc:443
    - source_labels: [__meta_kubernetes_node_name]
      target_label: __metrics_path__
      replacement: /api/v1/nodes/$1/proxy/metrics
Scrapes node-level metrics — CPU, memory, disk, network — from each node’s kubelet via the Kubernetes API proxy. The relabel rules here are doing something important: instead of hitting each kubelet directly (which would require node-level network access), all requests are routed through kubernetes.default.svc:443 and proxied to the right node. This works cleanly on Talos without needing to open extra ports.
cAdvisor (container metrics)
- job_name: "kubernetes-nodes-cadvisor"
  scheme: https
  tls_config:
    insecure_skip_verify: true
  bearer_token_file: /var/run/secrets/kubernetes.io/serviceaccount/token
  kubernetes_sd_configs:
    - role: node
  relabel_configs:
    - target_label: __address__
      replacement: kubernetes.default.svc:443
    - source_labels: [__meta_kubernetes_node_name]
      target_label: __metrics_path__
      replacement: /api/v1/nodes/$1/proxy/metrics/cadvisor
  metric_relabel_configs:
    - action: replace
      source_labels: [pod]
      target_label: pod_name
    - action: replace
      source_labels: [container]
      target_label: container_name
cAdvisor runs inside the kubelet and exposes per-container resource usage — CPU throttling, memory working set, network I/O per pod. Same API proxy trick as above, just a different path (/metrics/cadvisor). The metric_relabel_configs at the bottom rename pod → pod_name and container → container_name to make the labels consistent with what the Kubernetes Grafana dashboards expect.
Homelab-specific targets
These are the scrape jobs specific to what I’m running in my homelab:
- job_name: "rook-ceph-exporter"
  kubernetes_sd_configs:
    - role: endpoints
      namespaces:
        names:
          - rook-ceph
  relabel_configs:
    - source_labels: [__meta_kubernetes_service_name]
      action: keep
      regex: rook-ceph-exporter
Rook-Ceph exposes storage cluster metrics — OSD status, pool usage, I/O throughput. The namespace-scoped service discovery means it only looks inside the rook-ceph namespace instead of scanning the whole cluster.
- job_name: "qdrant"
  kubernetes_sd_configs:
    - role: endpoints
      namespaces:
        names:
          - qdrant
  relabel_configs:
    - source_labels: [__meta_kubernetes_service_name]
      action: keep
      regex: qdrant
Qdrant is a vector database I run on the cluster. It exposes collection sizes, query latency, and memory usage — useful to track when running embedding workloads.
- job_name: "ultron-nvidia-dcgm-exporter"
  static_configs:
    - targets: ["192.168.0.160:9835"]
  metrics_path: /metrics
  scheme: http
This one is outside the cluster entirely. I have a machine with an Nvidia GPU running the DCGM exporter as a container, and I scrape it directly via its static IP on my home network. Gives me GPU utilization, memory usage, and temperature in Grafana.
    resources:
      limits:
        cpu: 300m
        memory: 1G
Resource limits are intentionally conservative. With all these scrape jobs running every 15 seconds, VictoriaMetrics sits comfortably under 300m CPU and 600Mi memory on my cluster — the 1G limit gives it headroom during query spikes.
VictoriaLogs Single
victoria-logs-single:
  enabled: true
  server:
    retentionDiskSpaceUsage: 5GB
    persistentVolume:
      enabled: true
      accessModes:
        - ReadWriteOnce
      storageClassName: "ceph-block"
      size: 10Gi
    resources:
      limits:
        cpu: 300m
        memory: 512Mi
Pretty straightforward config. A 10Gi PVC backed by Ceph for storage, and retentionDiskSpaceUsage: 5GB as a hard cap — once log data hits 5GB on disk, VictoriaLogs starts dropping the oldest data to stay under the limit. This is a nice safety net so it never silently fills up the volume.
Resource limits are very light here — 300m CPU and 512Mi memory. In my experience VictoriaLogs sits well under both even with logs flowing in from all four nodes continuously.
VictoriaLogs Collector
victoria-logs-collector:
  enabled: true
  remoteWrite:
    - url: http://victoria-logs-single-server:9428
  resources:
    limits:
      cpu: 100m
      memory: 128Mi
    requests:
      cpu: 100m
      memory: 128Mi
  tolerations:
    - key: "node-role.kubernetes.io/control-plane"
      operator: "Exists"
      effect: "NoSchedule"
  nodeSelector:
    kubernetes.io/os: linux
The collector runs as a DaemonSet so there’s one instance on every node. The remoteWrite URL points at the VictoriaLogs single service using its in-cluster DNS name — this is the only config needed to wire the two together.
The tolerations block is the part that caught me out initially. By default Kubernetes won’t schedule pods on control plane nodes due to the NoSchedule taint. Without this toleration the DaemonSet skips your control plane entirely, which means you lose logs from kube-apiserver, etcd, and any other control plane components. On my Talos cluster that’s inferno-talos-cp-01 — adding the toleration ensures the collector runs there too.
The nodeSelector keeps it scoped to Linux nodes only, which on a Talos cluster is always the case but good practice to have explicitly.
VictoriaTraces Single
victoria-traces-single:
  enabled: true
  server:
    persistentVolume:
      enabled: true
      accessModes:
        - ReadWriteOnce
      storageClassName: "ceph-block"
      size: 10Gi
    resources:
      limits:
        cpu: 200m
        memory: 512Mi
The config here is minimal compared to the other components — and intentionally so. VictoriaTraces is still at v0.0.6 so I kept the setup as simple as possible: a 10Gi Ceph-backed PVC and conservative resource limits.
Out of the box it listens on two ports — 4318 for OTLP/HTTP and 10428 for its internal API (which is also what Grafana queries via the Jaeger-compatible endpoint). No extra config needed to get those working.
To actually get traces into it, your applications need to be instrumented with the OpenTelemetry SDK and pointed at victoria-traces-single-server.monitoring.svc.cluster.local:4318. Here’s a minimal example for a Python app:
from opentelemetry.sdk.trace.export import BatchSpanProcessor
from opentelemetry.exporter.otlp.proto.http.trace_exporter import OTLPSpanExporter

exporter = OTLPSpanExporter(
    endpoint="http://victoria-traces-single-server.monitoring.svc.cluster.local:4318"
)
Or if you’re using the OpenTelemetry Collector as an intermediary, just point its OTLP exporter at the same endpoint.
Note: VictoriaTraces is still very early in development. I’m using it in my homelab because the resource footprint is tiny and it integrates cleanly with the rest of the Victoria stack, but I wouldn’t lean on it heavily for anything critical just yet.
Grafana
grafana:
  enabled: true
  admin:
    existingSecret: "grafana-admin-secret"
    userKey: admin-user
    passwordKey: admin-password
Instead of hardcoding Grafana credentials in values.yaml, I’m pulling them from an ExternalSecret. The external-secrets.yaml in the chart root defines where to fetch them from:
apiVersion: v1
kind: Secret
metadata:
  name: grafana-admin-secret
  namespace: monitoring
type: Opaque
stringData:
  admin-user: foo
  admin-password: bar
Datasources
  datasources:
    datasources.yaml:
      apiVersion: 1
      datasources:
        - name: victoriametrics
          type: prometheus
          url: http://victoria-metrics-single-server.monitoring.svc.cluster.local:8428
          isDefault: true

        - name: victorialogs
          type: victoriametrics-logs-datasource
          url: http://victoria-logs-single-server.monitoring.svc.cluster.local:9428

        - name: victoriatraces
          type: jaeger
          url: http://victoria-traces-single-server.monitoring.svc.cluster.local:10428/select/jaeger
          jsonData:
            tracesToLogsV2:
              datasourceUid: 'victorialogs'
            tracesToMetrics:
              datasourceUid: 'victoriametrics'
Three datasources, all using full cluster-local DNS names. VictoriaMetrics is set as the default since most dashboards are metric-based. The tracesToLogsV2 and tracesToMetrics fields under the Jaeger datasource are what enable correlation in Grafana — from a trace you can jump directly to the related logs or metrics without leaving the UI.
The VictoriaLogs datasource plugin
The victorialogs datasource uses type: victoriametrics-logs-datasource which is not a built-in Grafana datasource. It’s a community plugin maintained by VictoriaMetrics that adds LogsQL support to Grafana’s Explore page and panels. Without it, Grafana has no way to talk to VictoriaLogs.
To install it, add it to the plugins list in your values:
  plugins:
    - victoriametrics-logs-datasource
This tells the Grafana Helm chart to install the plugin at container startup via GF_INSTALL_PLUGINS — no manual downloading or image rebuilding needed. Once it’s installed, the victoriametrics-logs-datasource type becomes available for datasource provisioning.
Note: The plugin requires network access at pod startup to download from the Grafana plugin registry. If your cluster has strict egress policies, you may need to allow outbound traffic to
grafana.comor use the init container approach described in the plugin docs.
Dashboards
  dashboards:
    default:
      victoriametrics:
        gnetId: 10229
        revision: 48
        datasource: victoriametrics
      kubernetes:
        gnetId: 14205
        revision: 1
        datasource: victoriametrics
      nvidia-gpu-metrics:
        gnetId: 14574
        revision: 11
        datasource:
          - name: DS_PROMETHEUS
            value: victoriametrics
Three dashboards auto-provisioned from Grafana.com by gnetId — no manual importing needed. They load on first startup and are ready to use immediately.
| Dashboard | gnetId | Purpose |
|---|---|---|
| VictoriaMetrics | 10229 | VM internals, ingestion rate, query stats |
| Kubernetes | 14205 | Cluster-wide resource overview |
| Nvidia GPU | 14574 | GPU utilization via DCGM exporter |
Sidecar dashboards
  sidecar:
    dashboards:
      enabled: true
      label: grafana_dashboard
      labelValue: "1"
      folder: /tmp/dashboards
This enables the Grafana sidecar — a container that runs alongside Grafana and watches for ConfigMaps with the label grafana_dashboard: "1" across the cluster. When it finds one, it automatically loads the JSON inside as a dashboard without any restart or manual import needed.
This is how I provision the custom k8s-logs-via-victorialogs dashboard that lives in my dashboards/ folder. The template in templates/dashboards/ wraps the JSON in a ConfigMap with the right label:
# templates/dashboards/k8s-logs-dashboard.yaml
apiVersion: v1
kind: ConfigMap
metadata:
  name: k8s-logs-via-victorialogs
  namespace: monitoring
  labels:
    grafana_dashboard: "1"   # <-- sidecar watches for this
data:
  k8s-logs-via-victorialogs.json: |
    { ... dashboard JSON ... }
The sidecar picks this up automatically and places it in /tmp/dashboards inside the Grafana container. Any ConfigMap in the cluster with that label gets treated the same way — so if you want to add more custom dashboards later, just create a ConfigMap with grafana_dashboard: "1" and the sidecar handles the rest.
Deploying the Stack
With the chart structure in place and values.yaml configured, deploying the entire stack is a single command:
helm upgrade --install grafana-victoria-stack . \
  --namespace monitoring \
  --create-namespace \
  --values values.yaml
--create-namespace handles creating the monitoring namespace if it doesn’t exist yet. The . tells Helm to use the local chart directory — since we already ran helm dependency update the charts/ folder is populated and ready.
You should see output like:
Release "grafana-victoria-stack" has been upgraded. Happy Helming!
NAME: grafana-victoria-stack
LAST DEPLOYED: Fri Mar 14 00:00:00 2026
NAMESPACE: monitoring
STATUS: deployed
REVISION: 1
Verifying the deployment
Give it a minute for all pods to come up, then check:
(⎈|inferno-talos:default) ➜  ~ k get pods -n monitoring
NAME                               READY   STATUS    RESTARTS       AGE
grafana-5f96686f5c-wgc69           2/2     Running   11 (11h ago)   20h
victoria-logs-collector-5wv5w      1/1     Running   8              7d22h
victoria-logs-collector-dk6nz      1/1     Running   0              11h
victoria-logs-collector-nx665      1/1     Running   24 (20h ago)   26d
victoria-logs-collector-tkmqd      1/1     Running   23 (20h ago)   26d
victoria-logs-single-server-0      1/1     Running   0              11h
victoria-metrics-single-server-0   1/1     Running   0              11h
victoria-traces-single-server-0    1/1     Running   0              11h
A few things to note here. The victoria-logs-collector shows four pods — one per node in my cluster, which is exactly what we want from the DaemonSet. The three Victoria storage components run as single replicas, each backed by their own PVC.
Check that the PVCs are all bound:
(⎈|inferno-talos:default) ➜  ~ k get pvc -n monitoring
NAME                                                                    STATUS   VOLUME                                     CAPACITY   ACCESS MODES   STORAGECLASS   VOLUMEATTRIBUTESCLASS   AGE
server-volume-grafana-victoria-stack-victoria-metrics-single-server-0   Bound    pvc-0e837872-51cb-4f67-8bc9-83cb1132e1cc   16Gi       RWO            ceph-block     <unset>                 60d
server-volume-victoria-logs-single-server-0                             Bound    pvc-603298b9-4369-4157-a637-b5ba96716212   10Gi       RWO            ceph-block     <unset>                 36d
server-volume-victoria-metrics-single-0                                 Bound    pvc-dfe558d8-3a12-45e1-9a27-edc375be1435   16Gi       RWO            ceph-block     <unset>                 60d
server-volume-victoria-metrics-single-server-0                          Bound    pvc-edbfc0b9-5d9d-468b-b41e-0c91c7682853   16Gi       RWO            ceph-block     <unset>                 60d
server-volume-victoria-traces-single-server-0                           Bound    pvc-86ae364d-3a0a-4cdc-8d9f-8a03bd6ab309   10Gi       RWO            ceph-block     <unset>                 36d
If any PVC is stuck in Pending, it usually means the storage class isn’t available — worth checking kubectl describe pvc <name> -n monitoring for the exact reason.
Quick sanity checks
Verify VictoriaMetrics is scraping targets:
kubectl port-forward svc/victoria-metrics-single-server 8428:8428 -n monitoring
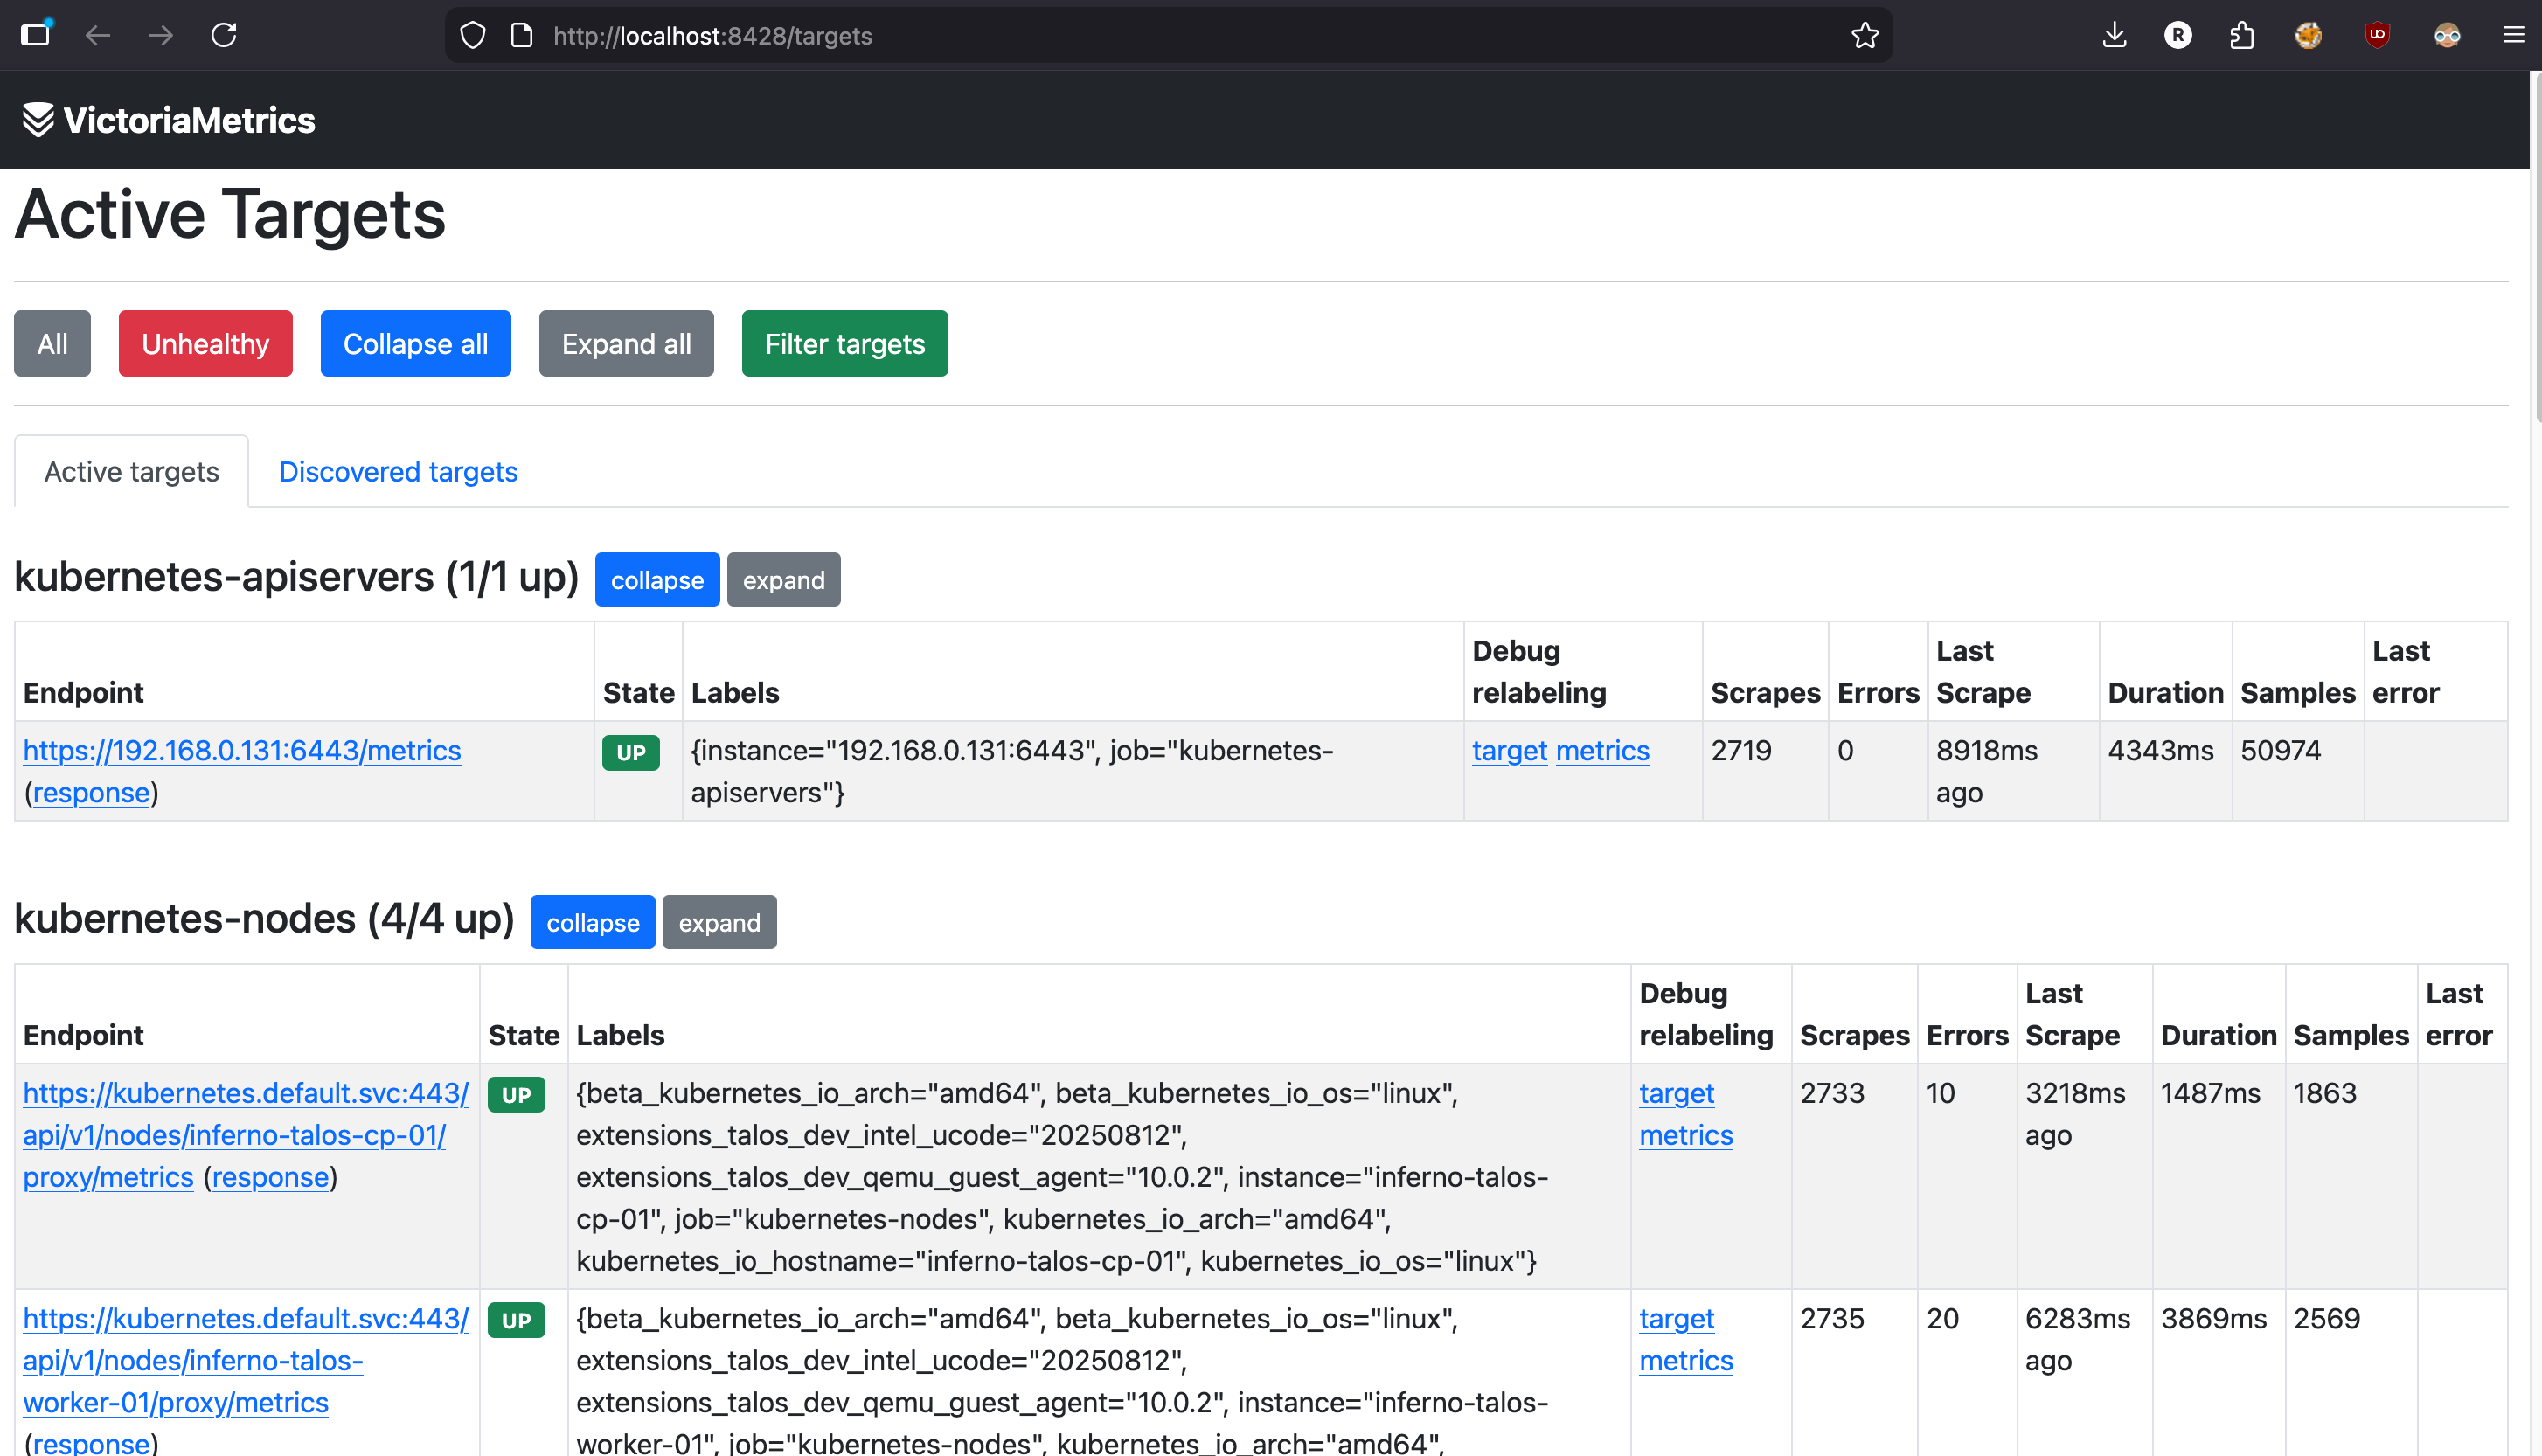 Open
Open http://localhost:8428/targets in your browser. You should see all your scrape jobs listed with a green UP status.
For VictoriaLogs, check that logs are flowing in:
kubectl port-forward svc/victoria-logs-single-server 9428:9428 -n monitoring
curl http://localhost:9428/select/logsql/query \
  --data-urlencode 'query=*' \
  --data-urlencode 'start=5m'
If you’re getting log lines back, the collector is shipping logs successfully.
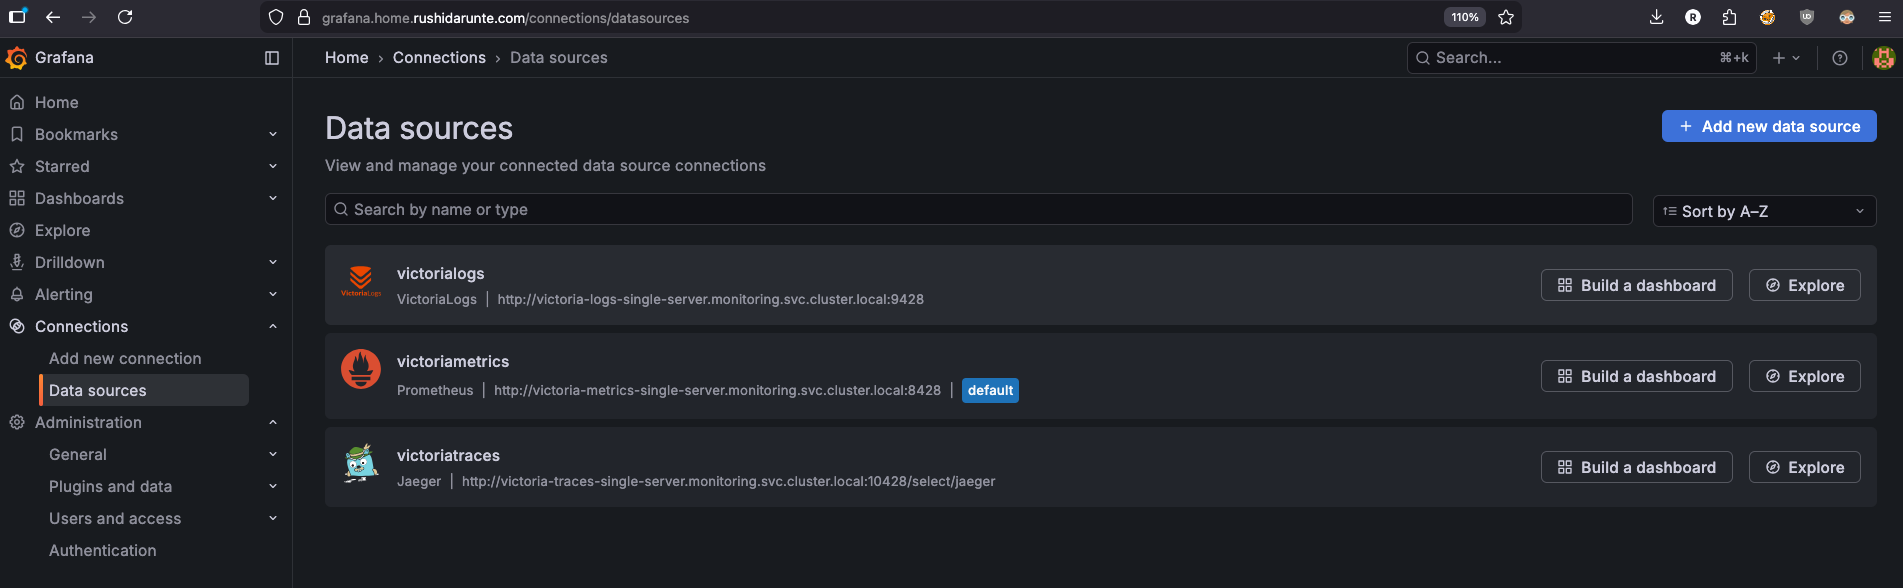
Accessing Grafana
Since I’m running a Gateway API route on my cluster, Grafana is accessible at https://grafana.home.rushidarunte.com — configured via the route block in values. If you’re not using Gateway API or any Ingress Controller, you can quickly access it via port-forward:
kubectl port-forward svc/grafana 3000:80 -n monitoring
Then open http://localhost:3000 and log in with the credentials from your grafana-admin-secret. Head to Connections → Data sources and you should see all three datasources — VictoriaMetrics, VictoriaLogs, and VictoriaTraces — already provisioned and ready to use.
Dashboards
Kubernetes Logs via VictoriaLogs
One of the most useful dashboards in my setup is the Kubernetes logs dashboard, built with the VictoriaLogs plugin. I imported it directly from the VictoriaMetrics demo dashboard — the JSON lives in my dashboards/ folder and gets provisioned automatically via the sidecar ConfigMap we covered earlier.
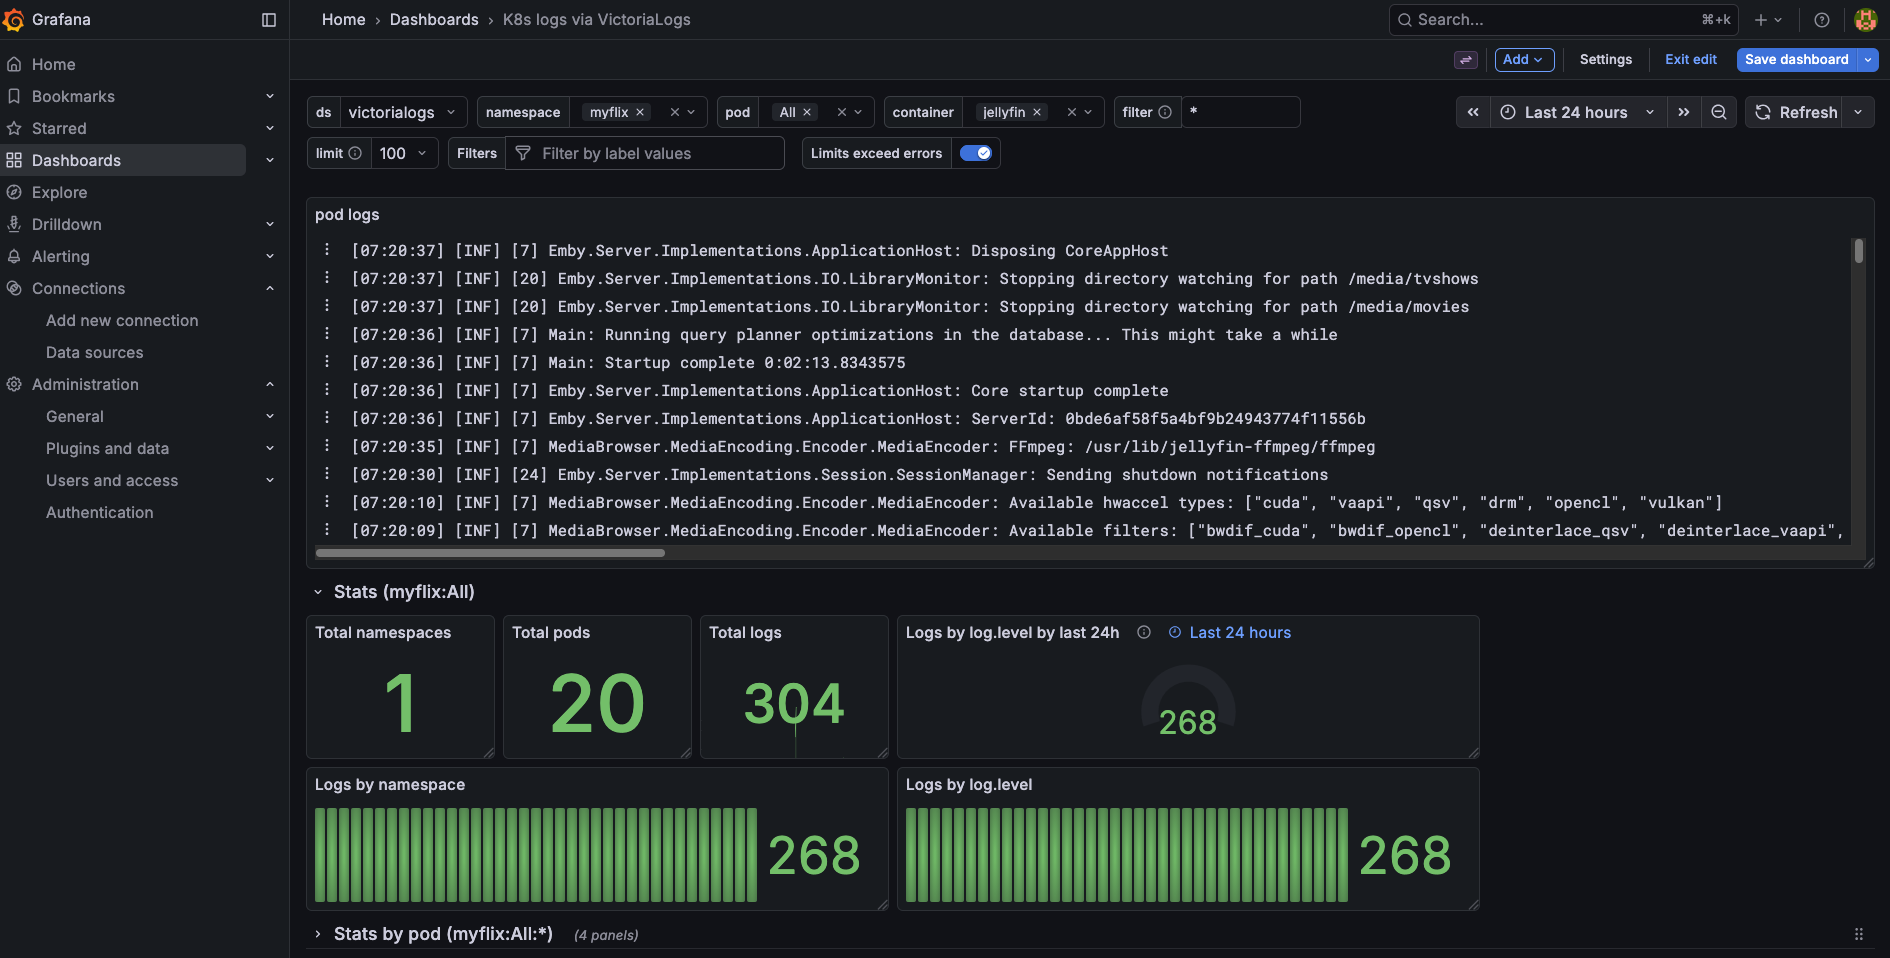 Kubernetes logs dashboard powered by VictoriaLogs and LogsQL
It gives you a clean view of logs across the entire cluster — filterable by namespace, pod, and container. The LogsQL query bar at the top lets you search across all your logs the same way you’d use Grafana Explore, but with a pre-built layout that’s immediately useful without any configuration.
If you want to use the same dashboard, grab the JSON directly from the VictoriaMetrics demo or the victorialogs-datasource repo and drop it into your dashboards/ folder. The sidecar will pick it up on the next sync.
Node Monitoring
The Kubernetes cluster overview dashboard gives me a quick glance at resource usage across all four nodes — CPU, memory, disk I/O, and network. This is the first thing I check when something feels slow on the cluster.
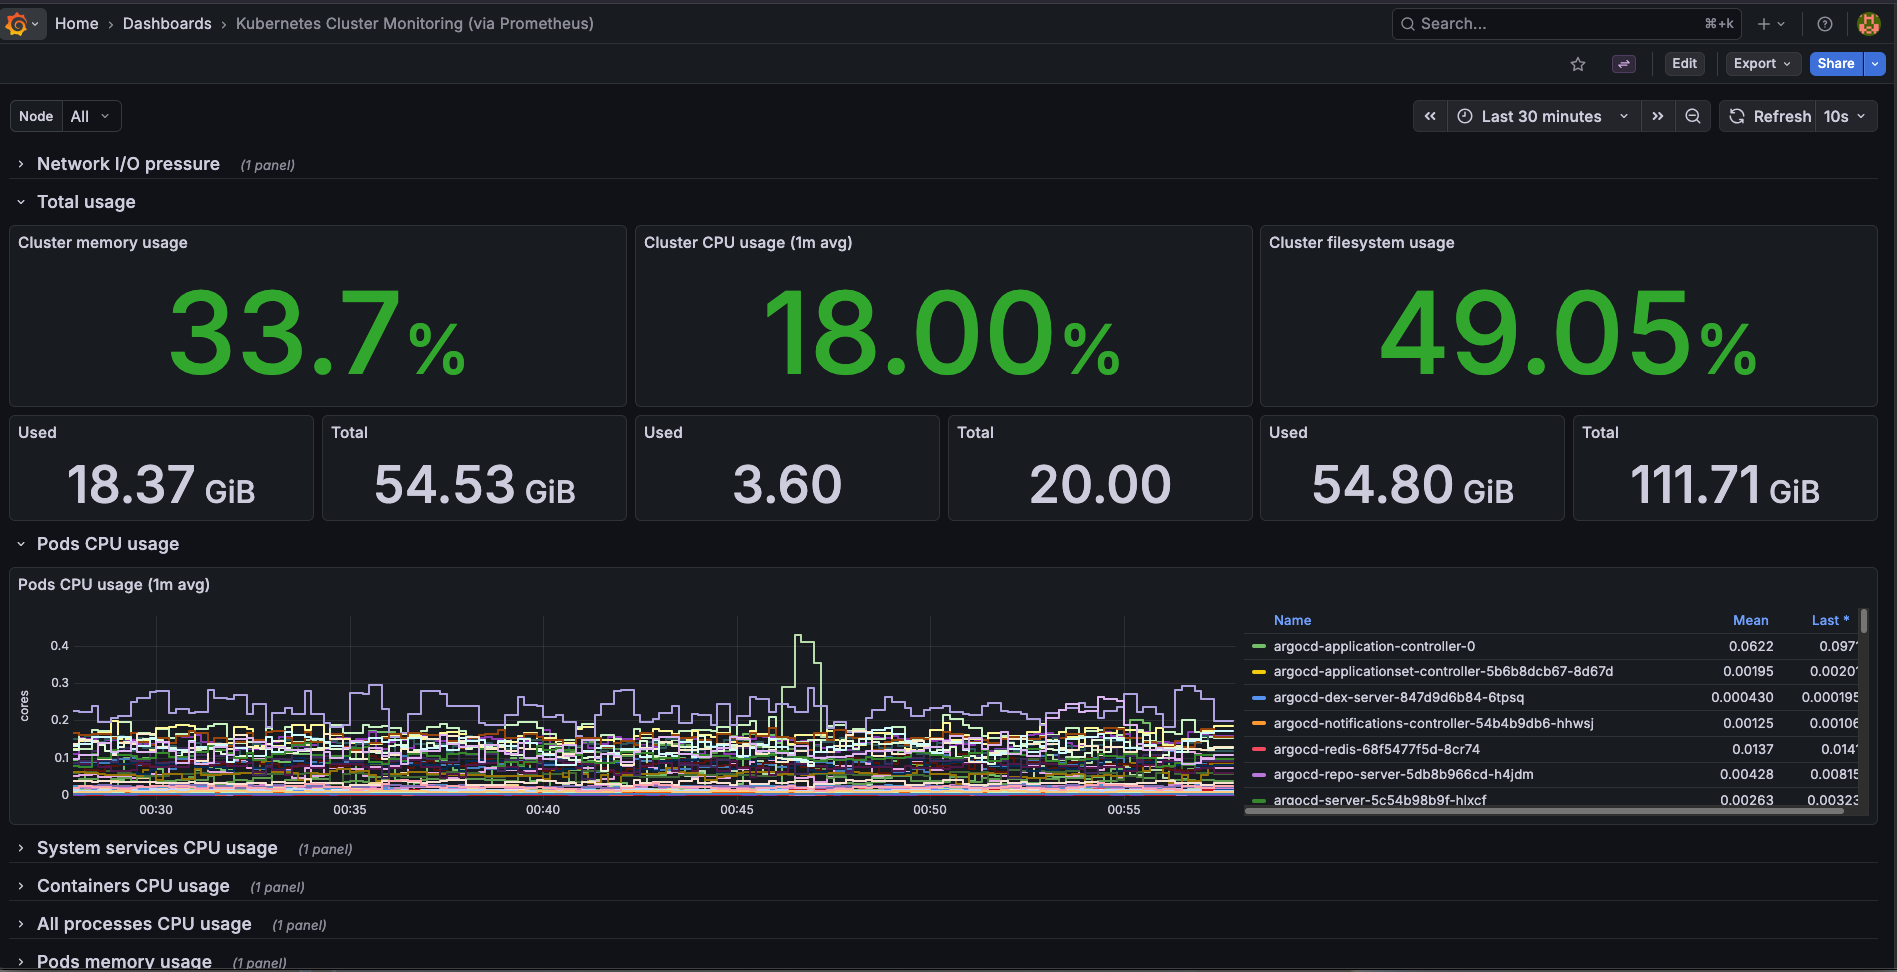 Per-node CPU and memory usage across the Talos cluster
Nvidia GPU — LLM Monitoring
This one is specific to my homelab setup. I run a few LLM models locally using llama-cpp, and the Nvidia DCGM dashboard is how I keep an eye on GPU utilization and VRAM consumption while models are loading or actively serving requests. When a model is being loaded into VRAM you can see a sharp spike on the memory graph, and during inference the GPU utilization climbs steadily depending on the request load.
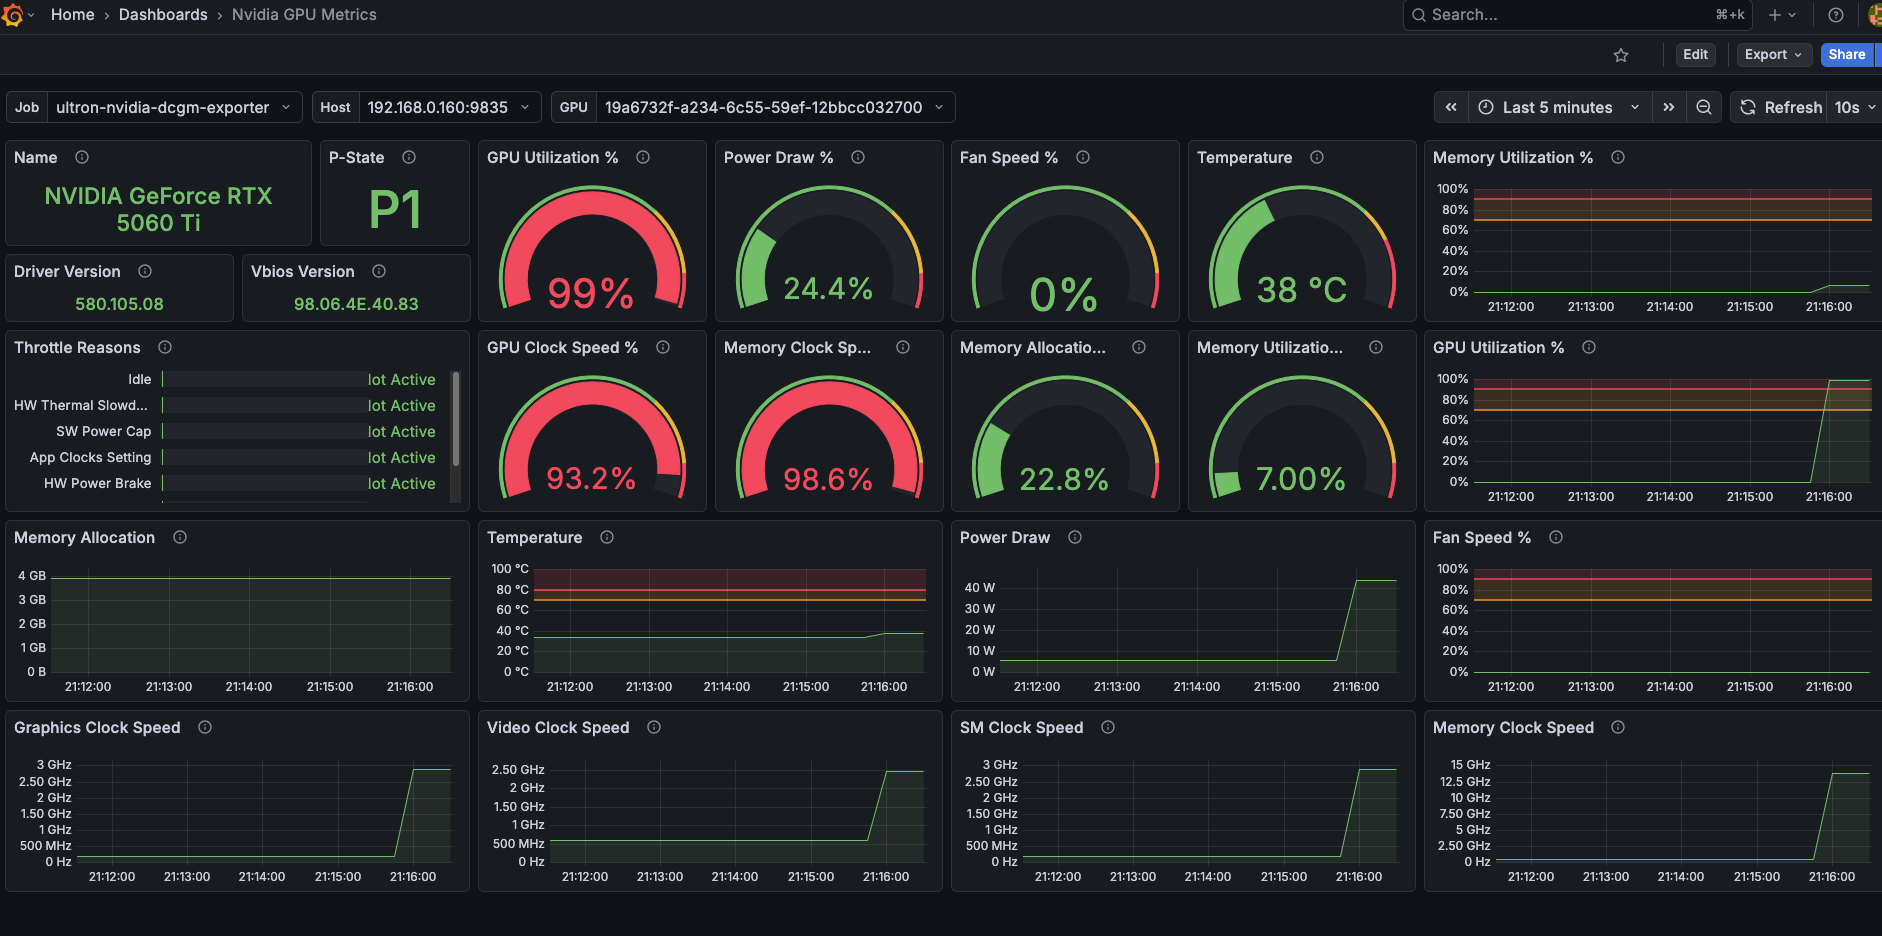 VRAM consumption and GPU utilization during LLM inference
Having this wired into the same Grafana instance as the rest of the cluster means I can correlate GPU pressure with pod-level metrics — useful when multiple workloads are competing for resources.
Conclusion
That’s the full observability stack running on my Talos homelab cluster — metrics, logs, and traces all flowing into a single Grafana instance, deployed and managed through one Helm chart. The whole thing sits comfortably within the resource limits I set, leaving plenty of headroom for the actual workloads running on the cluster.
The biggest win for me was collapsing what would normally be five or six separate Helm releases, multiple config files, and a lot of manual Grafana setup into a single helm upgrade --install command. If I need to rebuild the cluster or spin up a second environment, it’s fully reproducible from the chart and values.yaml alone.
There are still a few rough edges — VictoriaTraces is very early and I wouldn’t rely on it for anything critical yet, and the current setup still requires some manual steps in Grafana for things like alert rules and additional dashboard configuration.
What’s Next
In the next post I’ll go through making the entire Grafana setup fully declarative — managing dashboards, alert rules, and data source configuration through ConfigMaps and Kubernetes-native resources, so nothing requires manual clicking in the UI. If you’ve ever had Grafana lose its configuration after a pod restart, that post is for you.
Source
The full Helm chart for this stack is available on my GitHub. Feel free to use it as a starting point for your own homelab setup.
grafana-victoria-stack: https://github.com/x64nik/homelab/tree/main/kubernetes/helm-charts/grafana-victoria-stack